Tuesday, December 1, 2015

Wirelessly Debugging

Time: 10-15 mins

Prerequisites: Basic android development relating to USB debugging


Traditional USB debugging

When we get around to testing the android applications its usually faster and convenient to use an actual mobile to test the apps. But Android Studio 2.0’s instant run feature might change that.

So as google has given a comprehensive guide here, we can set USB debugging up and run the applications directly on our device.

But it always seemed to be kind of a pain to have the mobile always connected to the computer via USB. Especially if we had the misfortune of having a really short or loose cable.

When I was working on transferring data from a microcontroller to the mobile I discovered that there was a “Handsfree” way of doing this.

Wirelessly Debugging

So the idea here is that both the computer and the android device connects to the same network and so we can have a adb connection to the Android-powered device over that network.

You can find the adb tool in /platform-tools/. You can add that to your System Variables - Path variable, after which you can run adb shell and other commands easily from your command line once your android device is connected by USB to your computer.

Or you can start the command line in the platform-tools folder itself to run adb (Android Debug Bridge) commands.

So as shown above we can use the adb shell command to find the IP address assigned to the device by the router both the computer and the android mobile is connected to.Here it’s seen to be 192.168.1.34. You can also see it from your mobile’s wifi settings.

Once we have access to the adb and know the ip address of the mobile device, run the following commands in order.

  1. adb tcpip 5555

  2. adb connect <device-ip-address>:5555

In case you get a error saying its unable to connect use adb usb to restart the connection.

Once you see connected to 192.168.1.34:5555, you can now remove the USB connection and still be able to run app’s onto the mobile from Android Studio.

As you can see the device is recognized by the Device Chooser dialog box both via the USB connection and the network connection.

Sources

Friday, November 13, 2015

Education System & its relationship with memorization

With this post I hope to explore a question that has for long troubled me.
What exactly is the place of memorization in our current education system?
And more importantly,
What should be the place of memorization in an ideal education system?
The second question is one that we should keep in mind as we strive to improve our current education system. Because it's best that we openly admit our current failings. Any attempt to look away from our faults just makes it harder for us to improve ourselves.

There are many reasons why seem to hold on to the current method of education which made a lot of sense during the Industrial age when human resources were mainly valued as machines which performed tasks efficiently without room for creativity.

In those times, an employee taking initiative would usually ruin the plans laid down. So the emphasis was on remembering instructions and performing them without question.

But now with the advent of machines, any task which can be done in a mechanical fashion has been automated. As we move into the Information Age, its imperative that the education system stays updated.

I believe that the education system is still playing catch-up, and many other people have their own views - John Baker, The Big Picture, Naveen Jain, Justin Marquis, Shifting thinking just to name a few. I feel that Sir Ken Robinson’s ideas especially resonated with me. But its also important to read the other side of the argument.

Now I will be the first to admit I am biased, its evident to me that I am no good at remembering things I don’t understand and some even that I understand. So I could be suffering from a really strong case of sour grapes.

But it strikes me again and again at various points in my life that,
We should be studying to understand the concepts, not just to perform well in exams!
Most people seem to have forgotten how exams are supposed to be checkpoints, just things which help us reflect on how our pursuit of understanding is progressing.

Now it has turned into a goal by itself, with people trying to beat the system which evaluates them (i.e. the exam). This is plainly not good, because the way I see it the education system is structured in such a way that students (who are young, full of energy, filled with so much potential) are driven to develop ways to crack an artificial problem (the exam).
How does learning how to “score marks” help you? does it add value to society?
Now for that, I guess its possible that it improves our problem solving skills. After all even solving artificial problems should give us some practise. As sometimes it requires the student to analyse the teacher and what questions will come. Manage the limited time in a efficient manner. Even sharpen memory skills. But here another important point arises.

It’s not only about the pros we can find, rather it’s does the cons that exist outweigh the pros?
that is something each one of us should decide, and we do that everyday with our day to day decisions. Is achieving X worth the sacrifice of Y?

I would argue that most students forget the formula’s that they memorizes soon after the need for it vanishes, as many teachers have noted memorization often comes in the way of learning. Also until recent years remembering important “things” was a useful trait given that it was really tedious to find what you needed in a library of books. But with the advent of the internet, Wikipedia, and really smart search engines. Now it’s actually dangerous to rely solely on our human memory with which we are prone to mis-remembering some things.

So then why concepts? why do we need to remember concepts when even those can be found online! Here the thing is, we can’t search for something really specific if we don’t know it exists. So learning various concepts helps you become an actual problem solver. Where we use formulas only as tools to solve the problem. These tools were traditionally kept in our memory hence the reason for the traditional emphasis on rote memorization.

It’s a vicious cycle

Many students are left with almost no choice because society (companies, colleges) need some way of judging (when they have a large pool of applicants) students and exams are one such criteria.

Parents want the best for their child and from their point of view they fuel this greed for marks in order to ensure that their children have a secure future. The students themselfs suffer from loss of self confidence if they fail to get good marks.

Solutions? One of the important things is that a lot of exams are not properly set. Its actually really hard to develop a proper question paper which is hard to game. Therefore paper’s should be set under very strict standards keeping in mind that the objective is to test the student’s understanding of the subject rather than his short term memory.

Also society (parents, teachers, students) should develop awareness on what exams actually are and how they are not always an accurate measuring system. Its when the focus shifts to exams that students start to look for easy ways to score marks.

Its remembering something that you don’t understand for the sole purpose of scoring marks that I am against

even I memorized that the roots of the equation is
But just knowing it and not knowing how it came to be, just being able to use it and solve problems isn’t something that should be encouraged or applauded!
I don’t know what’s the matter with people: they don’t learn by understanding; they learn by some other way — by rote or something. Their knowledge is so fragile! - Richard Feynman
I haven’t covered all the points, or completely answered the 2 questions I asked at the beginning but I don’t want to make this too long. So in conclusion,

The main point I am trying to put across is that we should all think about this and if it makes sense, start admitting this problem is very real. We need discussion, we need people to worry about this. Then we can expect that in time some sort of improvement will come.

I am not naive enough to think we will all suddenly change the way we do things, but when I don’t see people actively discussing these things then I wonder. Are my arguments flawed? maybe I am missing some important points.

Or is the education system not worth worrying about? Isn’t it obvious that as long we don’t fix the education system, the future generation won’t know any better and any plans to improve the system gets delayed by a whole generation atleast!

Now you might be wondering why did I write about this now? well I got the motivation to actually sit down and write about this as I was overwhelmed while watching this series The Master of Study. Read more about that on my blog post on The Master of Study - not Learning.
Written with StackEdit.

Thursday, November 12, 2015

Position Invariant

I don’t know all the places where you might have come across this term, but I encountered it when studying image processing. They told me that the degradation function (used in image restoration) other than having the property of being “linear” also was “position invariant”.

Now I want to try to give a explanation of what that means, because most engineering students are pretty comfortable with the idea of what Linear functions are as they are used a lot in a lot of the courses.

Consider a image we have described spatially as , say that the image is transformed by a function . This means that the function H takes the image as input and gives a “degraded” image as output.

One mistake I initially made was that I thought of as a function from a image to a different image, its actually a collection of pixel-pixel mappings. For a particular value of we get relationship between the pixel intensities.

Why do we care about this degraded function? because the best way of reversing the effect of degradation is to first model it, then find a way to reverse engineer the image before this function was applied. Read more about that in Image Restoration.

but coming to the function , they say that it is postion invariant if

where

now, here a geometrical interpretation that I would like to present for this is that of two 2D planes, one with the domain of (lets call that the F plane) and the other with the domain of (lets call that the G plane).

Note that the plane is actually the image itself, with both x and y axis used to position each pixel in and .

Now can be thought of as lines starting from points in the F plane and ending up on some point on the G plane. For different functions, these lines will just move around and establish different relationships between the 2 planes.

The pixel to pixel mapping

In the above picture the red line represents the result of applying on a single pixel, when you apply on a image like , then will be a collection of such lines connecting all the points in .

Now the equation for position invariance makes a lot of sense! what the equation says is that if you take any of the lines connecting 2 points between the two planes; here as a example I consider the line (thick red line) starting from to the .

So now if I move a known distance away from this point, (in this case in negative direction and in the negative direction - shown by the yellow lines).

Then the mapping line will also move the exact same distance!

That is; if the mapping is position invariant then this new pixel at will map to the point .

Position Invariance explained!

You can sort of imagine it as the red line being fixed to the starting point in the F plane, so when you move the starting point around in the F plane your mapping function stays stiff and moves along with you.

That wraps that up.

Let me know your feedback and thanks for reading!

Written with StackEdit.

Tuesday, October 27, 2015

Industrial Instrumentation Mini Project

Industrial Instrumentation Mini Project

Both Thermistors and RTD’s are basically resistors whose resistance varies with temperature.

Thermistors differ from resistance temperature detectors (RTDs) in that the material used in a thermistor is generally a ceramic or polymer, while RTDs use pure metals. The temperature response is also different; RTDs are useful over larger temperature ranges, while thermistors typically achieve a greater precision within a limited temperature range, typically −90 °C to 130 °C.

linearization using parallel resistance

Parallel connection of resistance to thermistor

So we have high sensitivity and fast response in favor of thermistor, but the non linear behavior is a drawback that we must try to correct.
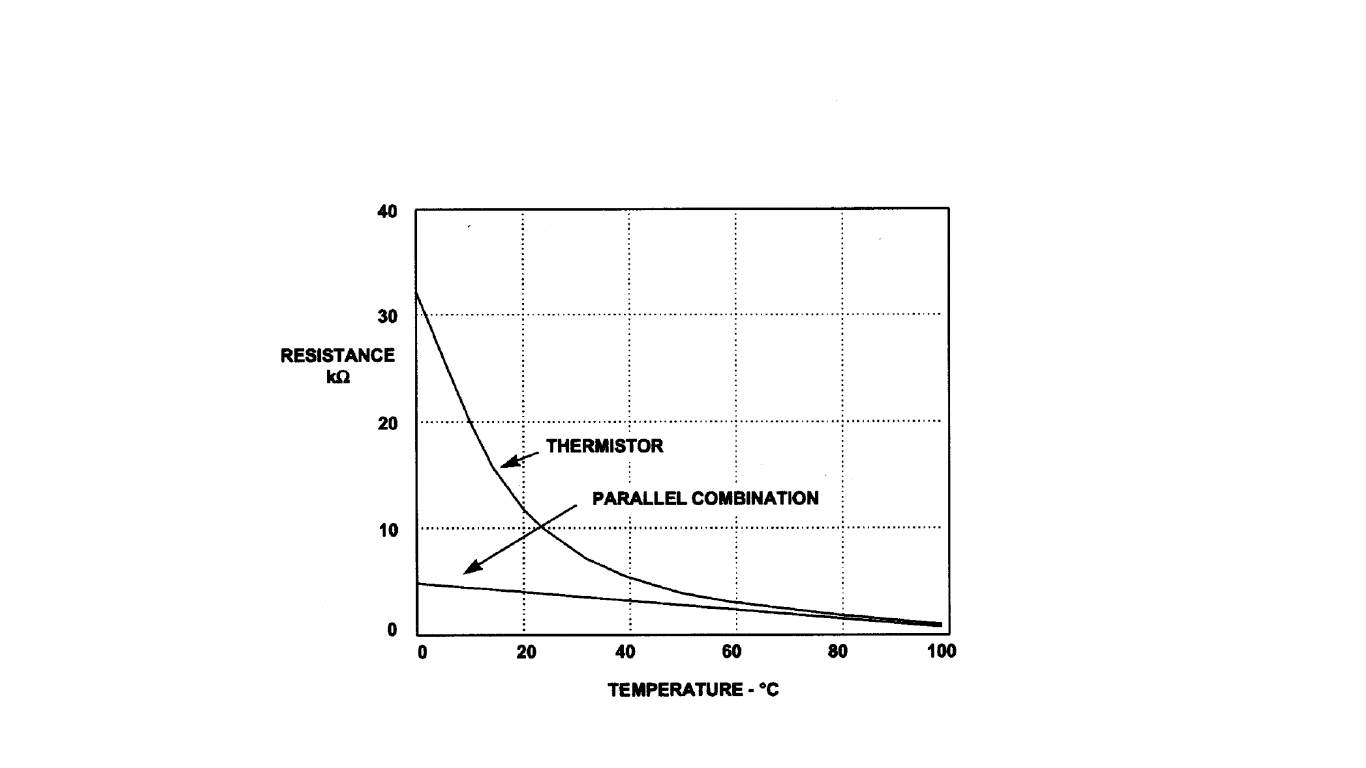
In tackling this problem the basic approach can be to connect a parallel resistor to the thermistor.

Linearization by connecting a resistance in parallel

But as you can see above even though this improves the resistance - temperature relationship in terms of linearity, the sensitivity of the thermistor is sacrificed.

Temperature to Period Linearization technique

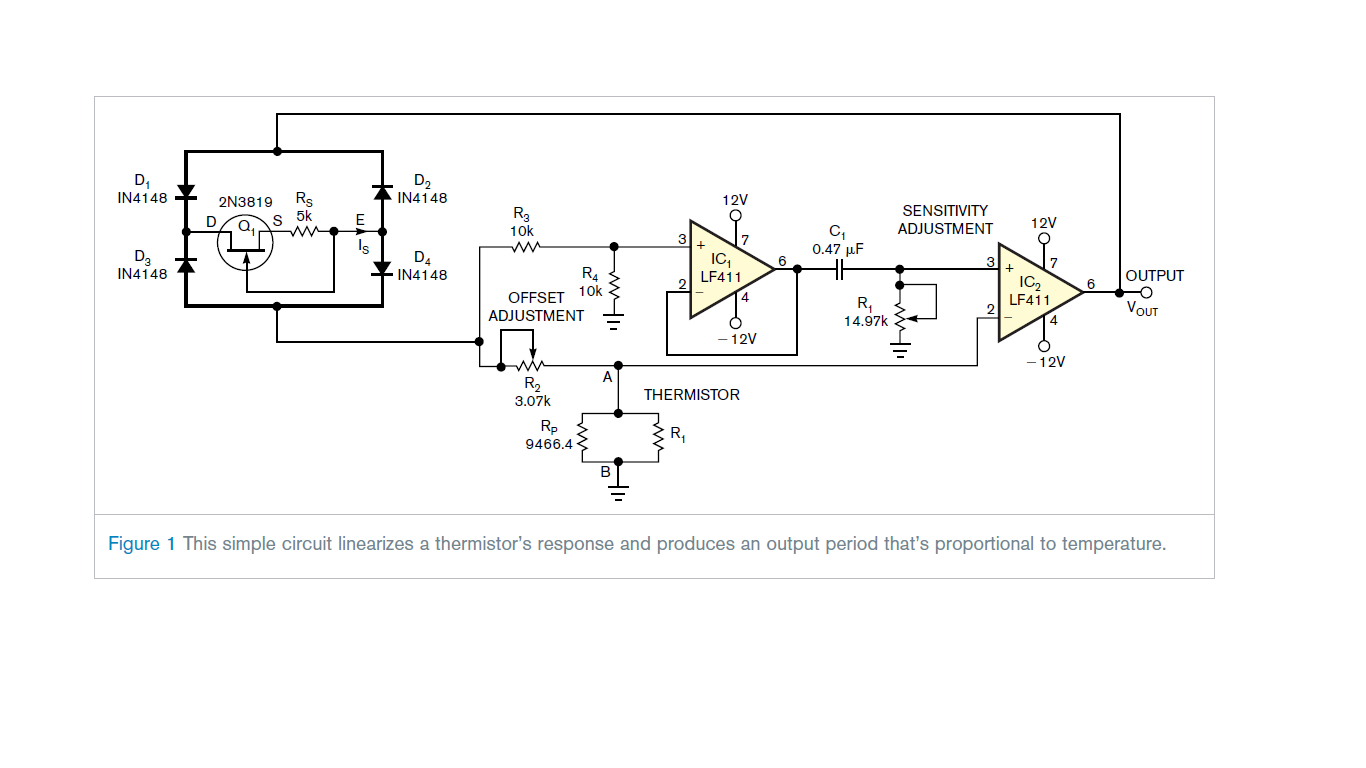
We will be using a circuit (shown below which functions as a relaxation oscillator) to get a linear relationship between our input variable (Temperature) and output variable (in this circuit it’s the time period).
It is important to note the importance of linearization, we have useful tools used in systems analysis which are applicable to linear systems.
So as it’s much easier to deal mathematically with linear relationships when compared to non linear systems.

Here the output will be a periodic waveform with a time period , here this output waveforms time period is the output variable which is linearised w.r.t. to temperature, unlike the thermistor’s resistance which is non linear w.r.t. to temperature.

Nonlinear behavior of thermistor resistance wrt temprature

Theoretical modeling of T - R characteristics

Now for the modeling of the relationship between the temperature and resistance for the thermistor we can use first order approximation, but this approximation involves assumptions such as carrier mobility’s invariance with temperature etc which are not valid across the entire operating range of the temperature.

Note that for a even more accurate description of the thermistor we use third order approximations like the Steinhart–Hart equation and Becker-Green-Pearson Law which has 3 constants.
Even the original Bosson’s law has 3 constants and is written as

This is approximated to the second order law,

In the above formula’s are constants and stands for temperature while stands for thermistor resistance.

The reason why we go for the 2 constant law rather than the 3 constant law even though the third order approximation fits better is that comparatively its harder to use hardware linearization techniques.1
Also this relationship closely represents an actual thermistor’s behavior over a narrow temperature range.

So if we are going for third order approximations we should use take advantage of the advancements in computing and just obtain a analog voltage proportional to the thermistor resistance, then use ADC to get the digital values which can simply be fed into the 3rd order equation.

Working of the circuit

Circuit Diagram for linearization of thermistor output

We should observe the non linearity error is within 0.1K over a range of 30K for this linearization circuit.

Read more from what S.Kaliyugavaradan has written.

References

Written with StackEdit.


  1. Wiley Survey of Instrumentation and Measurement, by Stephen A. Dyer published by John Wiley & Sons. Page 126
    Read here

Wednesday, October 7, 2015

Homomorphic filtering

Prerequisites : Basics of Fourier Transform, High pass filters in the context of Image processing.

I will be talking about this filtering method in terms of using it as an enhancement technique, but it can be leveraged for other uses also.

The Wikipedia Page and this blog explains this entire concept thoroughly.

First let me start with the illumination-reflectance model of image formation which says that the intensity of any pixel in an image (which is the amount of light reflected by a point on the object and captured by an imaging system) is the product of the illumination of the scene and the reflectance of the object(s) in the scene.

where is the image, is scene illumination, and is the scene reflectance. Reflectance arises from the properties of the scene objects themselves, but illumination results from the lighting conditions at the time of image capture.

This model should make sense because reflectance is basically the ratio of light reflected to the light received (illumination). But in case you are still not feeling like this equation makes sense then consider this image.

Golf ball

Here the image is the collection of values that tell us the intensity of light reflected from each point. For example the golf ball reflects more light, while the hole reflects less. These values form a matrix in the shape of the image - .

Now what causes the golf ball to reflect more light than the grass? it’s a property of the material which decides what wavelengths of light are reflected and which are absorbed. We call a measure of this property as reflectance and the matrix holds that value for all these points.

The imaging system - our camera, captures the light reflected from each point which is the product of the illumination hitting each point with the “reflectance” property of the material at these respective points.

So what we want is actually only that property - which will be faithfully reflected in the image matrix if the illumination on the objects are uniform. In the case we hide the golf ball under a shadow while shining light on the grass, the image will turn out to show the golf ball as not as white as it actually is.

Golf ball in the shade

Now in such images taken in non-uniform illumination setting, Illumination typically varies slowly across the image as compared to reflectance which can change quite abruptly at object edges.

If the light source is placed at such a position that it regularly illuminates the scene then we won’t have the problem of irregular illumination, but consider it being placed in a direction such that part of the scene is highly illuminated, while the remaining part of the scene is in the shadows. Now it should be obvious that due to the properties of light, the 2 areas are separated by fuzzy area where it’s not fully illuminated nor is it in the shadows. This is what I mean by the Illumination typically varies slowly across the image . For example check out the photo at the bottom of the post.

But objects stand out among the background because at the object edges the intensity of light reflected (as compared to the background) changes abruptly, as you can see the black text has a high contrast with the white background.

So as far as the image is concerned, the uneven illumination - is the noise (Multiplicative noise - because is multiplied to ) that we wish to remove. Because the illumination term is what causes part of the scene to be in the shadows, and is the signal that we need - it holds the information about everything ‘s visual properties (how much a particular point absorbs/reflects light)

In order to make this removal easy we shift the domain of the image from the spatial domain of to the domain - . Here,


The property’s of log makes the image such that these multiplicative components can be separated linearly in the frequency domain.

Illumination variations can be thought of as a multiplicative noise in the spatial domain while its linear noise in the log domain.

Now the question comes why linear, the point is that we need to be able to separate and , so that we can remove without harming

As we can see the Fourier transform - of the image (shifting it from spatial domain - to the frequency domain - ) does not separate the illumination and reflectance components. Rather the multiplicative components become convolved in the frequency domain as per the Convolution theorem.

But the log of the spatial domain - when shifted to frequency domain lets us express the the image (now ) as the linear sum of and because the fourier transform is linear.


Now that separability has been achieved, we can apply high pass filtering to ,

So as will have energy compaction among low frequency components, while will have the same for high frequency components. We can see that the term will become attenuated to a great degree (Depending on the filter and the cutoff frequency set).

so we will have

So now after the high pass filtering of the fourier of the log of actual image (Whew that was a stretch! lol)

we see that we get the fourier of the log of the reflectance component of the image - , and that was what we were trying to isolate all along.

so to get the reflectance back in the spatial domain we take the exponential of the inverse fourier transform of , so we get a close approximation to - .

To clarify why we do exponential and inverse fourier transform (IFT), we are just backtracking to the spatial domain, we are doing IFT to get back to the log of the spatial domain - . And then depending on the base we use to get the log domain (I assumed natural logarithm so I said exponential), if you use base 10, then we need to do to the power 10 in order to get back to (x,y).

And so we have successfully filtered out the multiplicative noise that is the slowly varying illumination - from the image - .

I got the code from the blog post I mentioned at the top of the post. My modifications were minor, I just added a line to convert the image to grayscale in case you wanted to operate homomorphic filtering on a color image.

and the results when I ran it on a irregularly illuminated image was pretty awesome - Output of homomorphic filtering with HPF

I know it’s tough to argue that the right image is enhanced visually w.r.t human eyesight, but as you can see the “irregular illumination” has disappeared. This shows us how homomorphic filtering is just another tool in our toolbox and has its own use cases.

Written with StackEdit.

Matrix Chain Multiplication

We got a assignment problem from our IC 303 DATA STRUCTURES AND ALGORITHMS , I’ll be going into its portions in detail too. But for today’s post I will solve the following problem of Matrix Chain Multiplication and hope the explanation of this problem will help bring clarity to how useful dynamic problem can be in solving problems.

The Assignment Problem

Find the cost involved in finding the product of 6 Matrices using both

  1. Dynamic programming (Matrix Chain Multiplication)
  2. Normal matrix multiplication.

Given,

Now first of all, what is cost here? I think its reasonable to assume the cost (time complexity) can be thought of as the total number of scalar multiplications to obtain .

For calculating given that,

its trivial to prove that the number of scalar multiplications required are .

For each element of we need to do multiplications, for the first row of we have such elements(size of each row), so multiplications.

Finally we have such rows (number of rows), so total number of scalar multiplications to calculate is

For example check out the image below where are 4,2,3.

Matrix Multiplication

Normal matrix multiplication.

Ok, now we have defined what is cost let’s see what the cost of the Normal Multiplication of the The Assignment problem is,

now by normal multiplication lets consider the grouping as shown below,

So here first is done in
then that solution with is done in

Thus in the Normal method we need to perform scalar multiplications.

Now it should be obvious we can find by different methods which will change as we change how we group the 6 matrices.

Therefore the matrix-chain multiplication problem is given a chain of matrices to multiply, we need to find the grouping which minimizes the total number of scalar multiplications

In most cases the time we spend to find this special grouping is more than made up by the savings in the effort to actually compute the solution.

Now ok cool, we now know that we need to group these matrices, what’s the total number of ways that can be done?

Going by brute force then using the native algorithm the time complexity is,

while we get for the dynamic programming solution to finding the grouping.

So we can agree we need to use dynamic programming to optimally parenthesize a matrix chain.

Dynamic programming

I hope you all know that Divide and conquer algorithms works on the principle that we take a problem, make it into subproblems (divide) and recursively solve it (conquer).

Now what if when you applied this kind of problem solving strategy to a problem and discovered that you were repeating your work. That the subproblems that you were solving weren’t unique… would you solve them again and again? Nope, we would use the solution we already got with the first occurrence of that particular subproblem right?!

So that’s the basic idea of how Dynamic programming works. So when we see a problem with both Overlapping subproblems (this means that the subproblems repeat themselves) and Optimal substructure (which just means that it’s possible to solve this problem optimally by joining the optimally solved subproblems) we can use D.P.

So in the case of this Matrix Chain Multiplication problem what’s this “optimal subproblem” look like?

The crucial idea is that given a set of matrices then the Matrix Chain Multiplication problem can be broken down to,
Finding ( ) such that both the group of matrices to as well as the group of matrices to are optimally arranged for multiplication.

Thus

where p is the number of rows of the first matrix,
q is the number of rows of th matrix
or the number of column of th matrix,
r is the number of columns of the th matrix.

So here the first two terms are the cost of optimally solving the subproblems (i.e. consider the set of matrices and as subproblems) now when you join those two subproblem solutions you get the optimal solution to the original problem involving . That’s the key idea here.

Optimal solution of =
The term is incurred by the joining of the two subproblem solutions. (the first solution is a matrix and the second solution is a matrix.)

[TO BE CONTINUED]

Written with StackEdit.

Saturday, September 19, 2015

Discrete images and image transforms

Discrete images and image transforms

Here I will talk about Images and the forms in which we manipulate it.

An image can be defined as a two-dimensional function , where and are spatial (plane) coordinates, and the amplitude of/at any pair of coordinates is called the intensity of the image at that point.

The term gray level is used often to refer to the intensity of monochrome images. Monochrome images contain just shades of a single colour.

Color images are formed by a combination of individual such images.
For example in the RGB colour system a color image consists of three individual monochrome images, referred to as the red (R), green (G), and blue (B) primary (or component) images. So many of the techniques developed for monochrome images can be extended to color images by processing the three component images individually.

A interesting thing that I came across was that the additive color space based on the RGB color, doesn’t actually cover all the colours, we used this model to fool the human eyes which have 3 types of cones which are (due to evolutionary reasons) sensitive to Red, Green and Blue light.
If we mixed Red and Green, it would look yellowish to us, but a spectrum detector would not be fooled.
Additive color is a result of the way the eye detects color, and is not a property of light.

Lets check out some basic MATLAB code to see how the 3 channels of red blue and green make up a colour image.

Images are read into the MATLAB environment using function imread,
we use % to make comments.

img = imread('lenna.png'); % img has a RGB color image
imtool(img)

with imshow command we can view the image,

Original Image

using the imtool command we can see how each pixel has the 3 corresponding intensities, the variable img will also tell us how there are 512*512 pixels, and each pixel has 3 values.

imtool in use

As you can see each pixel has an intensity value for each of the 3 channels (RGB), we can use the following MATLAB code to see the 3 monochrome images which make up the original image.

red = img(:,:,1); % Red channel
green = img(:,:,2); % Green channel
blue = img(:,:,3); % Blue channel
a = zeros(size(img, 1), size(img, 2));
just_red = cat(3, red, a, a);
just_green = cat(3, a, green, a);
just_blue = cat(3, a, a, blue);
back_to_original_img = cat(3, red, green, blue);
figure, imshow(img), title('Original image')
figure, imshow(just_red), title('Red channel')
figure, imshow(just_green), title('Green channel')
figure, imshow(just_blue), title('Blue channel')
figure, imshow(back_to_original_img), title('Back to original image')

Now with this code red, blue and green are 512*512 matrices, the 3 of which together was img. a is just a black image of same size, it’s used to make the grey monochrome images red, blue and green into shades of the colors red, blue and green respectively. The cat function concatenates arrays along specified dimension (the first argument can be 1,2,3… and its for concatenation along rows, columns and as an array of matrices in the case of 3 ) so when they use 3 they are doing the reverse of what they did in decomposing the original image which had three 512*512’s matrices.

Blue Channel

Green Channel

Red Channel

But to really get an idea of much each color contributes to the final image we need to look at the 3 images in grey monochrome, just add these 3 lines of code,

figure, imshow(red), title('Red channel - grey monochrome')
figure, imshow(green), title('Green channel - grey monochrome')
figure, imshow(blue), title('Blue channel - grey monochrome')

and we get an image where the darker it is, the less the intensity value and vice versa.

Blue In grey monochrome

Green In grey monochrome

Red In grey monochrome

Sampling and Quantization

The function we talked about above, when you consider a real life image is actually continuous with respect to the x- and y-coordinates, and also in amplitude. Converting such an image to digital form requires that the coordinates , as well as the amplitude , be digitized. Digitizing the coordinate values is called sampling; digitizing the amplitude values is called quantization. Thus, when x,y, and the amplitude values off are all finite, discrete quantities, we call the image a digital image.

I recommend Digital Image Processing Using MATLAB® by Ralph Gonzalez (Author), Richard Woods (Author), Steven Eddins (Author). Chapter 2 should bring anyone up to speed with using MATLAB in image processing.

Frequency Domain of Images

Now that we have seen how we store images in discrete form, when we come to transforming it.
From what was taught to me in class we went directly into playing with the image in the frequency domain. Spatial filtering comes later, so for now let me tell you about a idea which I really wanted to write about. How the frequency domain is so important.

First of all let me refresh your memory about vector spaces, I will be drawing an analogy between a vector and a image,
the key idea is that an image can be considered to be the linear combination of the basis images just like how a vector can also be considered to be linear combination of the basis vectors!

now lets the extend the analogy, consider the vector space consisting of vectors of the form

Similarly consider the set of all monochrome images, for simplicity’s sake let it be a square image with 9 pixels. we can represent such images using matrices of size , say with a value of 0 indicating black
1 indicating white and the values in between denoting a shade of grey.

Now that the foundations have been laid, lets ask ourselfs how exactly is the “image” being stored? well its stored in a matrix with values that indicate the varying shades of grey for each pixel. The point I am trying to make here is that the image data is distributed spatially, we basically take the entity known as a image and fragment it into multiple pieces known as pixels and then we encode the data in the form of intensity of the various pixels.

Now lets take this same thing into the vector space discussion, a vector (in at least) has 3 components, when we store it we separate it into the 3 integer values that make it up.

Similarly lets look at the standard basis of ,

so, yeah we can construct any vector in by a linear combination of the 3 Standard basis vectors given above..

But what does that mean? and why are these 3 standard when we can take any 3 orthogonal vectors to do this job!

See what this means is that these three Standard basis vectors point in the direction of the axes of a Cartesian coordinate system and when we represent a vector as a linear combination of these 3 vectors, then the scalars we get as coefficients to each the basis vectors represents the amount the vector contributes to the direction of the respective basis vector.

This has practical importance as when we have a vector which tells us say for example the velocity of a object, then it’s important to know what the component of that velocity along the three axises are, this is known as resolving into components.

So the point is when we choose a set of basis for our vector space what we are essentially doing is choosing in what way we want to represent the vectors themselves. We choose the standard basis vectors in the case of the vector space because the information we get (when we break any vector in that space into a linear combination of these basis vectors) is the coefficients of these basis vectors, these scalar values encode the information about the vector in a way that is useful to us!

Whew that was awesome right?!

Now comes the Image’s frequency domain part, this is not as straightforward as the vector space.

So the matrix we talked about is used to encode the image discretely in the spatial domain, but when we talk about the frequency domain what do we mean? And also what are the basis images we use in the monochrome images vector space?

Okay to answer these questions let’s think about natural images, instead of defining the shade of each and every pixel in the image what could be a better way of thinking of/encoding a image.

well the idea that DCT uses is that in normal natural images we will have portions of slowly varying pixels (The sky, ocean, skin etc). Because the pixels of a region are similar in intensity these pixels are said to be correlated, this sort of correlation makes the spatial domain method of storing the image kind of redundant right? we should stop looking at an image as a collection of pixels, instead think of a image as a literal weighted superposition of a set of basis images, where each of the basis images will be orthogonal to each other. The weights used in this linear combination will signify the amount of contribution each of the basis image makes towards the final image.

To illustrate this let’s consider a small image, with 64 pixels, a square matrix could represent it. To see it clearly we zoom in 10x times.

The letter A

Now there are various transforms such as DCT, DFT, Hadamard, K-L etc
each of these provide us with a different way to arrive at the basis images.
Each of them have their own pro’s and con’s, For now let me show you the basis images used in the DCT transform.

The first 64 DCT basis images

If you notice you can see how there are 64 basis images, also towards the top left corner the images are smoothly varying while as we go towards the bottom left corner we can see that the image is rapidly varying. Thus when we find the scalar value corresponding to each of these basis image such that the linear combination is the small image, then the low frequency coefficients are the coefficients of the smoothly varying images, while the high frequency coefficients are that of the rapidly varying basis images in the bottom right corner.

Thus the array of these coefficients are known as the DCT of the image and it encodes the image as the weighted superposition of a set of known basis images. For the image given above the DCT would be

DCT of 8x8 image of A

Superimposing the coefficients over the basis images we get a proper idea of how much each basis image contributes to the final image.

DCT coefficients superimposed over basis images

Thus to get the image back we do the weighted sum, as shown below

Doing the weighted sum

The image on the left is seen to grow closer and finally become the actual image, which is actually a pretty blurred A. The image on the middle is the product of the coefficient and the corresponding basis image (shown on the right).

So now I hope you understand what we mean by the frequency domain, these coefficients are the representation of the image in the frequency domain, and the coefficient matrix is the transformed image itself.

We saw the basis images used in the DCT transform, here as our objective was to segregate the image in terms of its smoothly varying and sharply changing patterns we used these basis states. Thus the key point I wanted to share was that these basis states are chosen out of a wish to look at the image from a particular perspective.

Just as how we used the standard basis when we wanted the vectors in terms of their components in the axes, we choose basis states for images because we want to want to understand it terms of some idea.

In brief the idea which motivates DCT is smoothness,
DFT is periodicity in the image,
Walsh–Hadamard transform is also about periodicity but has a computational edge over DFT as it doesn’t require multiplication, (only addition and subtraction needed) when computing it.

But the idea behind KL transform is brilliant and I think I’ll cover that in detail on my post on the Image Transforms.

Well as usual, any and ALL feedback is welcome.

Many thanks to,

Digital Image Processing Using Matlab,
Ralph Gonzalez, Richard Woods, Steven Eddins

Hanakus

Written with StackEdit.

Thursday, September 17, 2015

Image Processing Introduction

IC 040 IMAGE PROCESSING

This is my elective of my fifth Semester, I had to choose between Image Processing, Power Electronics, and Digital Signal Processing.

I had pegged P.E to be a really theoretical subject with definitions etc, but it turns out they have got a really awesome temp faculty who uses graphs to talk in detail about the subject.

In I.P (Image processing - an acronym I will be using from now on)
I plan to use code samples to illustrate all points that I learn, for this I will be using MATLAB, and python libraries such as PIL, numpy, mathplotlib, scipy etc. I recommend getting a mathematical package like Python(x,y) rather than installing these packages separately on your python installation.

These are my portions, and just as no subject is boring, I don’t think any subject for any course in my college has a seriously out of date syllabus. So here goes :-

Linearity and space-invariance, PSF, Discrete images and image transforms, 2-D sampling and reconstruction, Image quantization, 2-D transforms and properties.

Image enhancement - Histogram modelling, equalization and modification. Image smoothing , Image crispening. Spatial filtering, Replication and zooming, Generalized cepstrum and homomorphic filtering.

Image restoration - image observation models. Inverse and Wiener filtering. Filtering using image transforms. Constrained least-squares restoration. Generalized inverse, SVD and interactive methods. Recursive filtering.Maximum entropy restoration. Bayesian methods.

Image data compression - sub sampling, Coarse quantization and frame repetition. Pixel coding - PCM, entropy coding, runlength coding Bit-plane coding. Predictive coding. Transform coding of images. Hybrid coding and vector DPCM. Interframe hybrid coding.

Image analysis - applications, Spatial and transform features. Edge detection, boundary extraction, AR models and region representation. Moments as features. Image structure. Morphological operations and transforms. Texture Scene matching and detection. Segmentation and classification.

Yeah so when I saw the portions it looked really daunting to me too!
But here goes,

Imaging Systems and their relationship with Point Spread Function

Discrete images and image transforms

Written with StackEdit.

Point Spread Function

Imaging Systems and their relationship with Point Spread Function

Here I will be talking about what a PSF (Point Spread Function) is and what its relationship with imaging systems are, later I will talk about the space invariance property of imaging systems and how it helps us.

First of all perfect imaging systems just isn’t possible, to understand why watch this.

They explain with a simple single lens system, which focuses the light rays coming from an object (kept really far away so that the light rays hitting the lens can be assumed to be parallel to each other) to the focal point of the lens on the other side.

Even using aberration free lens (such that the point of convergence would be an actual point instead of a blurred point shape) the intensity of the light at the point would tend to infinity and the electric field would easily be large enough to ionize the surrounding air.

Here the lens is the imaging system, the object can be thought of as the input to the imaging system which gives us the image as the output.

Now that we know we will have some lower limit on the size of the image formed, what does this mean?

if we have 2 objects which are too close to each other, our imaging system may not be able to resolve these 2 distinct objects into 2 distinct images!
so the size of the smallest image it can resolve tells us how far apart these objects must be in order for it to be able to tell them apart. This ability of the imaging system to resolve details is known as Optical resolution

The image formed by a point source of light kept really far away from the imaging should give us that right? and that is the PSF!!

The point spread function (PSF) describes the response of an imaging system to a point source or point object.

  1. The PSF in many contexts can be thought of as the extended blob in an image that represents an unresolved object.
  2. The PSF is the impulse response of a focused optical system
  3. The PSF is in functional terms the spatial domain version of the Optical transfer function of the imaging system.

The first point explores the fact that the distortion present even with the point source will be present in even amounts with a larger object image combination. The way I think of it is that the image formed will be resolved to about the precision set by the PSF. You will have a fuzzy region around the formed image at about the size of the PSF.

Yeah we supply the impulse input to the imaging system and record its response which is the impulse response.

The optical transfer function is defined as the Fourier transform of the impulse-response of the optical system, also called the point spread function. So as we all know the Fourier transform of the impulse response of a LTI system gives us its frequency response, and here the Fourier transform takes the PSF from its spatial domain into the frequency domain.
The optical transfer function provides a comprehensive and well-defined characterization of optical systems, so the PSF also plays a important role here.

And this video explains how Aberrations increases as increases,

because of the diffraction of light

So if is too large aberrations become a problem,

But also how decreases ( better resolution) with larger .

here,
is the size of blurred point formed (essentially the resolution)
is the focal length of the lens
is the wavelength of the light
and is the size of the aperture.

Therefore we can see how the PSF gives us the measure of the imaging system, if the PSF of a imaging system is large and spread out then that means that imaging system has more aberrations etc.
But if the PSF is well contained it means the opposite and can tell us how the imaging system has negligible aberrations.

Thus the degree of spreading (blurring) of the point object is a measure for the quality of an imaging system.

But actually the PSF is much more than that, as we can see from the 4 points noted above.

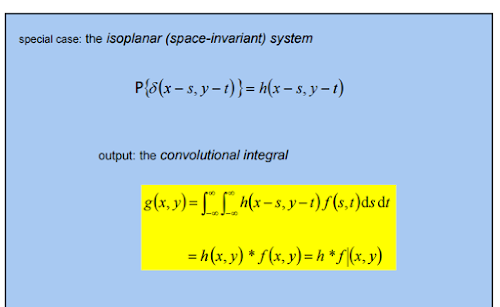
As the PSF is the impulse response of the imaging system, this lets us calculate the output of the imaging system as the convolution integral of the system input with the PSF.
That is of course only if the imaging system in question is a additive linear two-dimensional imaging system. Oh and it should also be space invariant!

Here is the impulse response or the PSF, is the system input and is the output, but lets look at the mathematics behind this relationship.

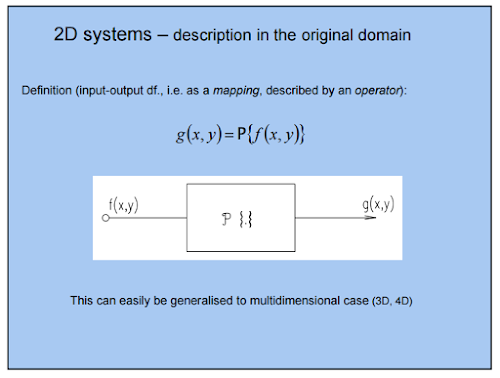
is a two dimensional system, in its most general form, is simply a mapping of some input set of two-dimensional functions to a set of output two-dimensional functions where are spatial variables.

This is the definition for a imaging system P

Also note we consider to be a additive linear two-dimensional imaging system.
This assumption of linearity is well founded as in non-coherent imaging systems such as fluorescent microscopes, telescopes or optical microscopes, the image formation process is linear in power and described by linear system theory. This means that when two objects A and B are imaged simultaneously, the result is equal to the sum of the independently imaged objects. In other words: the imaging of A is unaffected by the imaging of B and vice versa, owing to the non-interacting property of photons.

We can write the output G in terms of the superposition integral as follows,
Note that s and t are dummy variables used in the integral.
is the Dirac delta function

Output using convolution integral

The input is written as the sum of amplitude weighted
Dirac delta functions by the sifting integral,
The imaging system’s response to the impulse input given by is (Impulse Response or The PSF)

Space Variance

Now generally if the impulse response is space variant then we have to stop at the superposition integral as the extent to which we can relate these quantities, But in the special case that the additive linear two-dimensional imaging system is space invariant, then the superposition integral reduces to the convolution integral.

enter image description here

Now comes the question what does it mean when we say the imaging system is Space Invariant?

well mathematically speaking we can just say - In the case when,

i.e the impulse response depends only on the factors & .

Intuitively, in an optical system this implies that the image of a point source in the focal plane will change only in location, not in functional form, as the placement of the point source moves in the object plane.

That’s it folks looks like I wrote more than a thousand words, Any sort of feedback is welcome.

Many thanks to,

Jiří Jan
Department of Biomedical Engineering
Brno University of Technology
Czech Republic

William K Pratt
Author of Digital Image Processing: PIKS Scientific Inside

And of course Wikipedia!

Written with StackEdit.

Saturday, September 12, 2015

Hello World

Hello World

I am getting back to blogging after a kind of sabbatical,
lets get to learning and sharing.

I plan to use this post to test MarkDown and pagedown-extra
and also get familiar with StackEdit.


we can use control+B to make Bold text

while control+I is for Italic

I made a link to google using control+L
I guess cause L stands for Link

ctrl+B gets a Blockquote

ctrl+K is to write Code
  1. ctrl+O for Ordered lists
  2. which are numbered as we can see.

ctrl+R to add a horizontal Rule

  • ctrl+U for unordered lists
  • for which bullets are used.

and ctrl+H for a Heading

This is a double hashed heading

We use latex to write equations given below

integrals such as the Gamma function, fractions and powers

we can have sigma with limits and variables with subscripts

Other symbols include

We can also add comments to the document.

I used ctrl+G to add this image

enter image description here


Well my publishing of the document seems to be a problem,
on my wordpress site the Latex isn’t loading!
But on my blogger I got it working by using a dynamic template

Hope to add more later, signing off

Aditya A Prasad

Written with StackEdit.